Home /
Expert Answers /
Economics /
2-the-following-graph-shows-the-demand-marginal-revenue-average-total-cost-and-marginal-cost-c-pa784
(Solved): 2. The following graph shows the Demand, Marginal Revenue, Average Total Cost, and Marginal Cost c ...
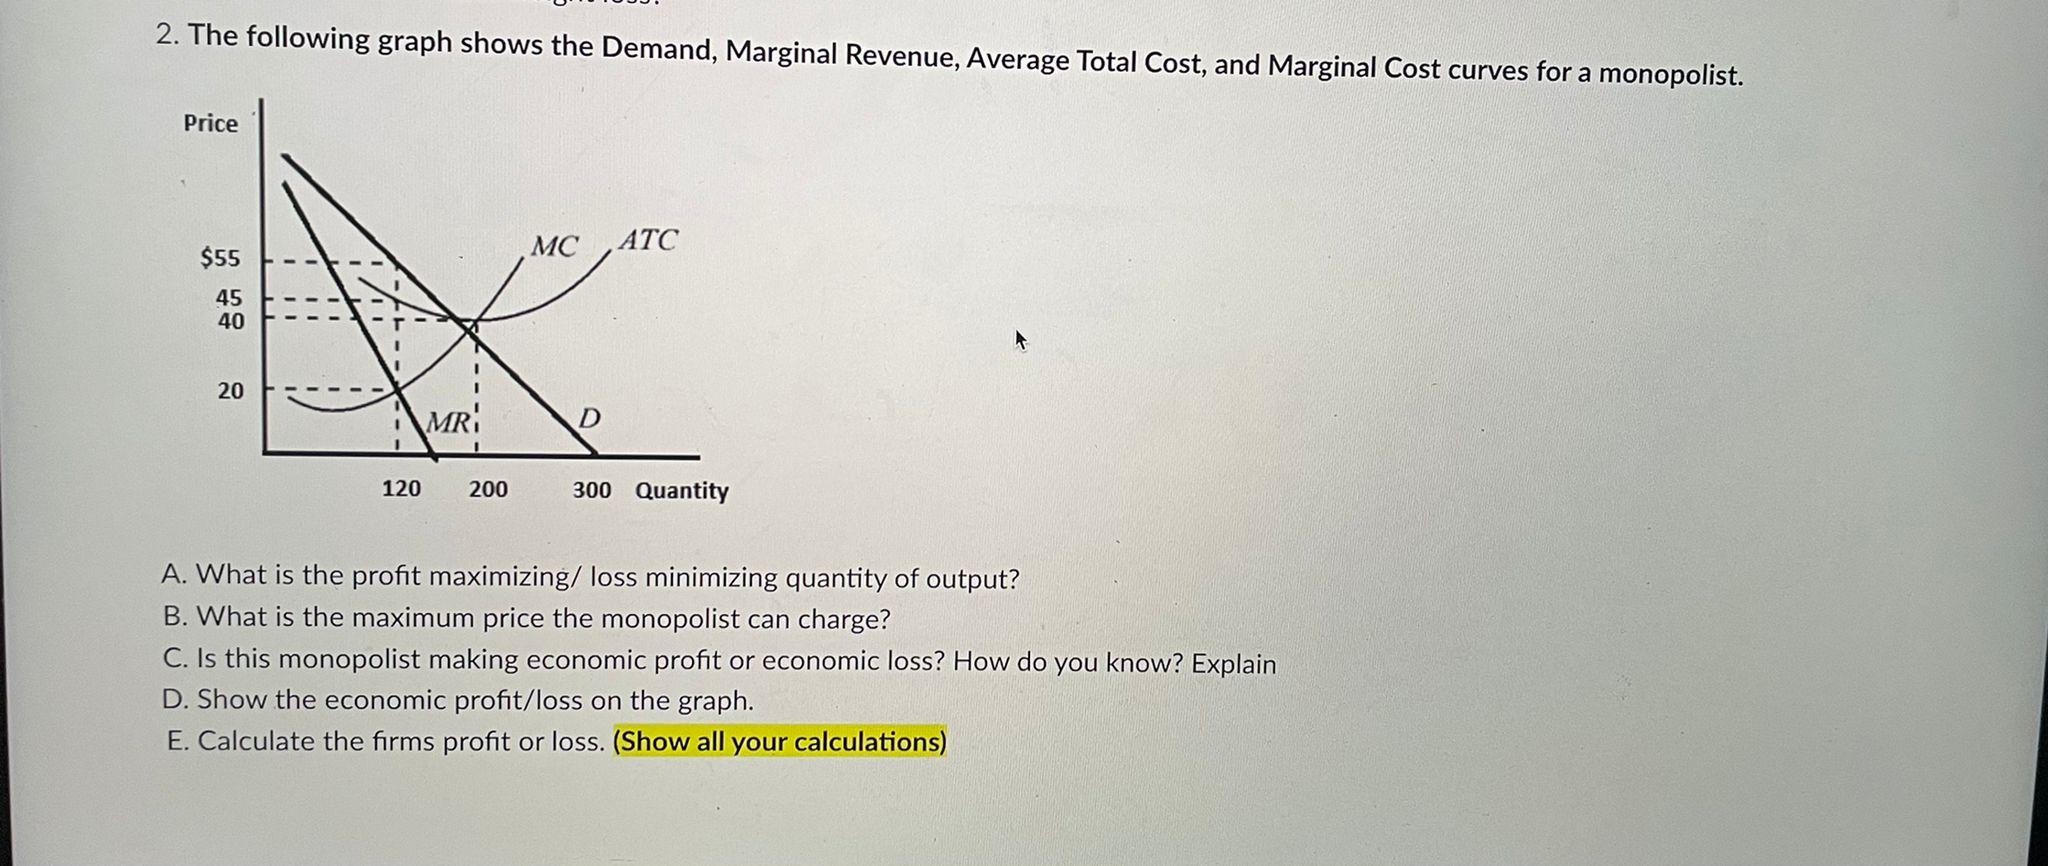
2. The following graph shows the Demand, Marginal Revenue, Average Total Cost, and Marginal Cost curves for a monopolist. A. What is the profit maximizing/ loss minimizing quantity of output? B. What is the maximum price the monopolist can charge? C. Is this monopolist making economic profit or economic loss? How do you know? Explain D. Show the economic profit/loss on the graph. E. Calculate the firms profit or loss. (Show all your calculations)
Expert Answer
Hello learner Question-1- Here the profit maximizing output for monopolist is 120 because at this point Mc=MR. Ques
