Home /
Expert Answers /
Physics /
2-the-figure-at-right-shows-position-time-graphs-of-two-cars-as-they-move-along-the-same-axis-an-pa730
(Solved): 2. The figure at right shows position-time graphs of two cars as they move along the same axis. An ...
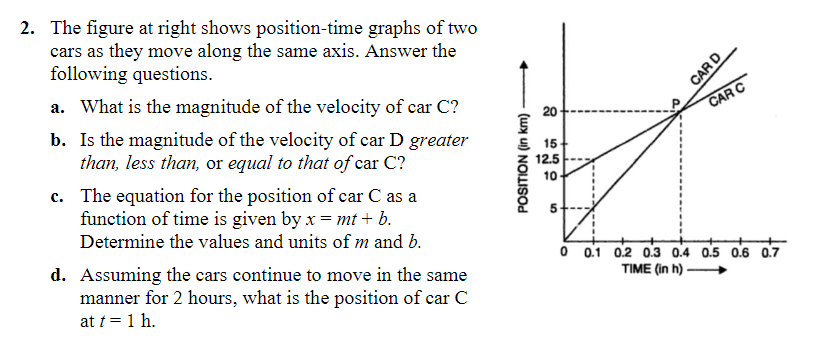
2. The figure at right shows position-time graphs of two cars as they move along the same axis. Answer the following questions. a. What is the magnitude of the velocity of car \( \mathrm{C} \) ? b. Is the magnitude of the velocity of car D greater than, less than, or equal to that of car \( \mathrm{C} \) ? c. The equation for the position of car \( \mathrm{C} \) as a function of time is given by \( x=m t+b \). Determine the values and units of \( m \) and \( b \). d. Assuming the cars continue to move in the same manner for 2 hours, what is the position of car C at \( t=1 \mathrm{~h} \).
