Home /
Expert Answers /
Physics /
2-the-diagram-below-shows-a-series-of-measured-equipotential-curves-near-a-positive-source-charge-pa151
(Solved): 2. The diagram below shows a series of measured equipotential curves near a positive source charge ...
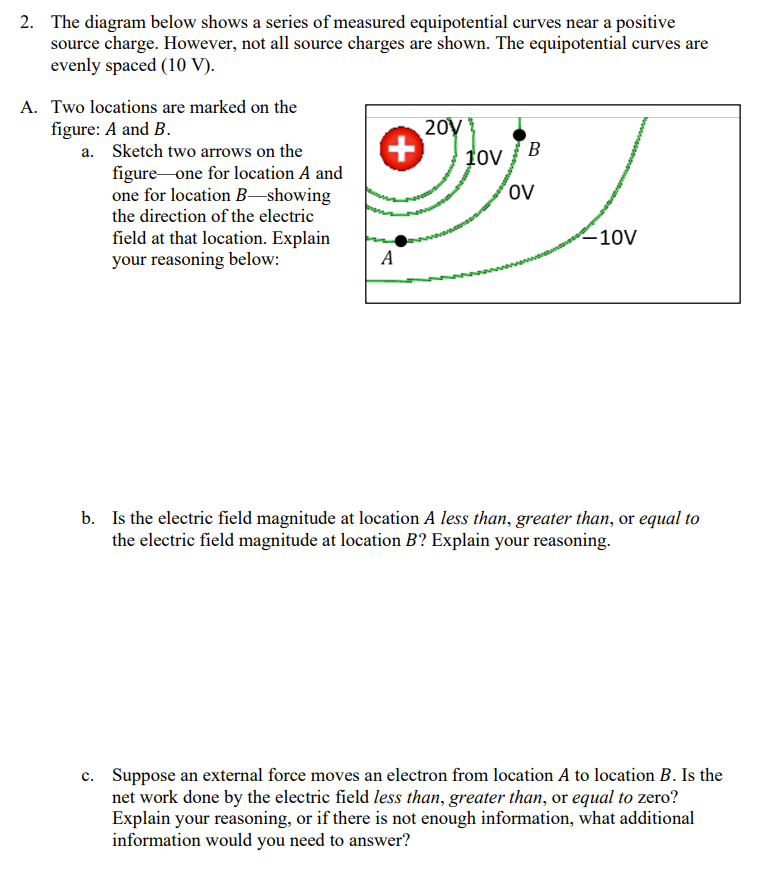
2. The diagram below shows a series of measured equipotential curves near a positive source charge. However, not all source charges are shown. The equipotential curves are evenly spaced (10 V). A. Two locations are marked on the figure: and . a. Sketch two arrows on the figure - one for location and one for location -showing the direction of the electric field at that location. Explain your reasoning below: b. Is the electric field magnitude at location A less than, greater than, or equal to the electric field magnitude at location ? Explain your reasoning. c. Suppose an external force moves an electron from location to location . Is the net work done by the electric field less than, greater than, or equal to zero? Explain your reasoning, or if there is not enough information, what additional information would you need to answer?
Expert Answer
PART A The direction of arrows of electric field direction is given as: This is the direction of electric field (given by arrows) at A and B.