Home /
Expert Answers /
Statistics and Probability /
2-statistical-process-control-chart-table-2-shows-the-slip-ring-diameter-pa315
(Solved): 2. Statistical Process Control Chart Table 2 shows the slip-ring diameter \( ...
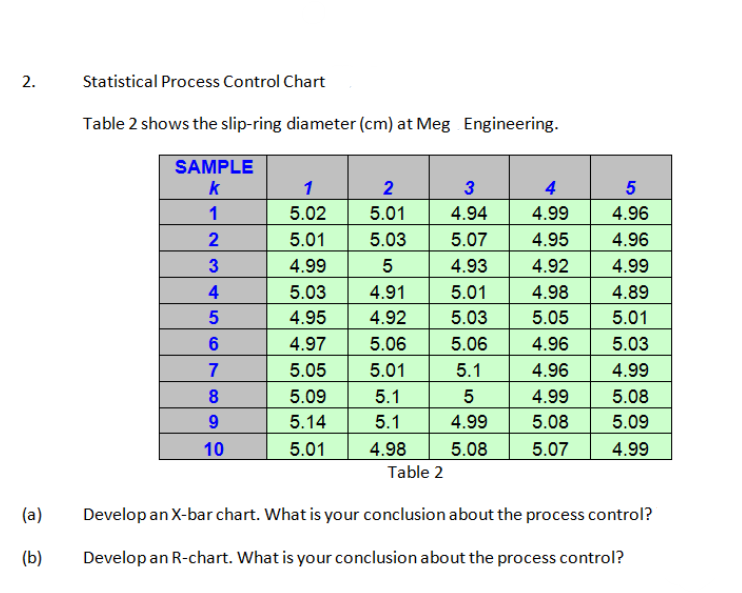
2. Statistical Process Control Chart Table 2 shows the slip-ring diameter \( (\mathrm{cm}) \) at Meg Engineering. Iable 2 (a) Develop an X-bar chart. What is your conclusion about the process control? (b) Develop an R-chart. What is your conclusion about the process control?
Expert Answer
From the given information Sample k Sample observation (1) (2) (3) (4) (5) Total Sample Sample mean Sample Range (R) 1 5.02 5.01 4.94 4.99 4.96 24.92