Home /
Expert Answers /
Statistics and Probability /
2-mean-and-median-figure-3-7-displays-three-density-curves-each-with-three-points-marked-pa722
(Solved): 2. Mean and median. Figure \( 3.7 \) displays three density curves, each with three points marked ...
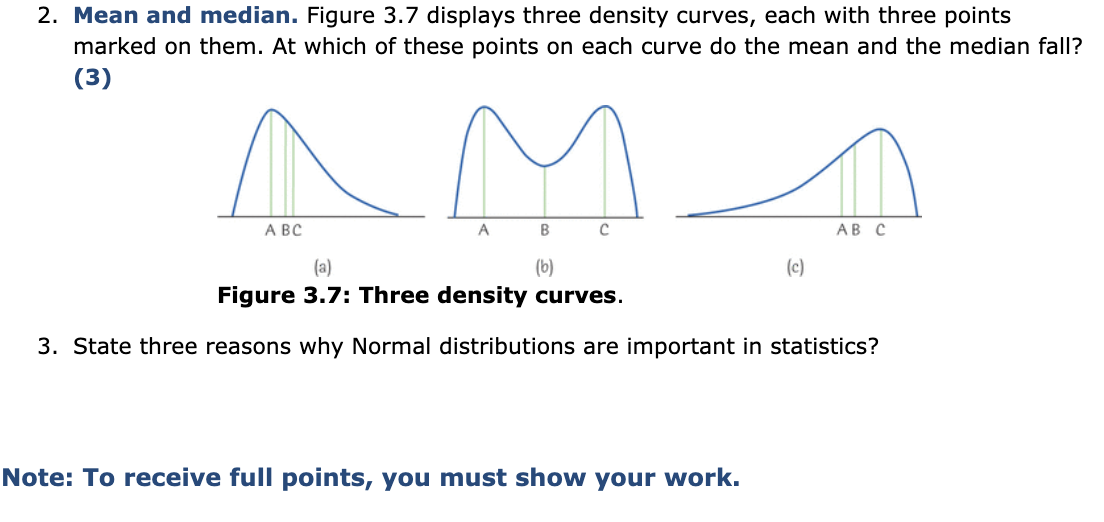
2. Mean and median. Figure \( 3.7 \) displays three density curves, each with three points marked on them. At which of these points on each curve do the mean and the median fall? (3) (b) (c) Figure 3.7: Three density curves. 3. State three reasons why Normal distributions are important in statistics? Note: To receive full points, you must show your work.
Expert Answer
2) when data is symmetric the mean = mod