Home /
Expert Answers /
Economics /
2-graphing-demand-for-labor-and-computing-the-optimal-quantity-consider-a-company-operating-in-a-pa960
(Solved): 2. Graphing demand for labor and computing the optimal quantity Consider a company operating in a ...
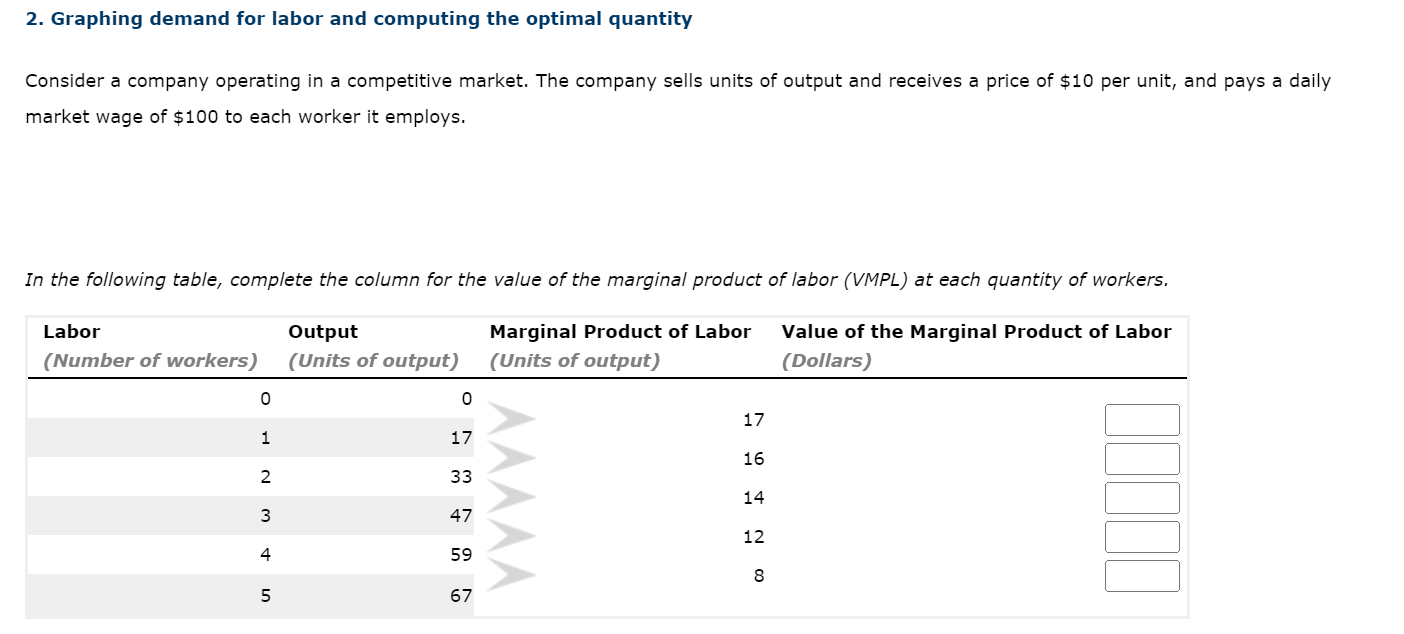
2. Graphing demand for labor and computing the optimal quantity Consider a company operating in a competitive market. The company sells units of output and receives a price of \( \$ 10 \) per unit, and pays a daily market wage of \( \$ 100 \) to each worker it employs.
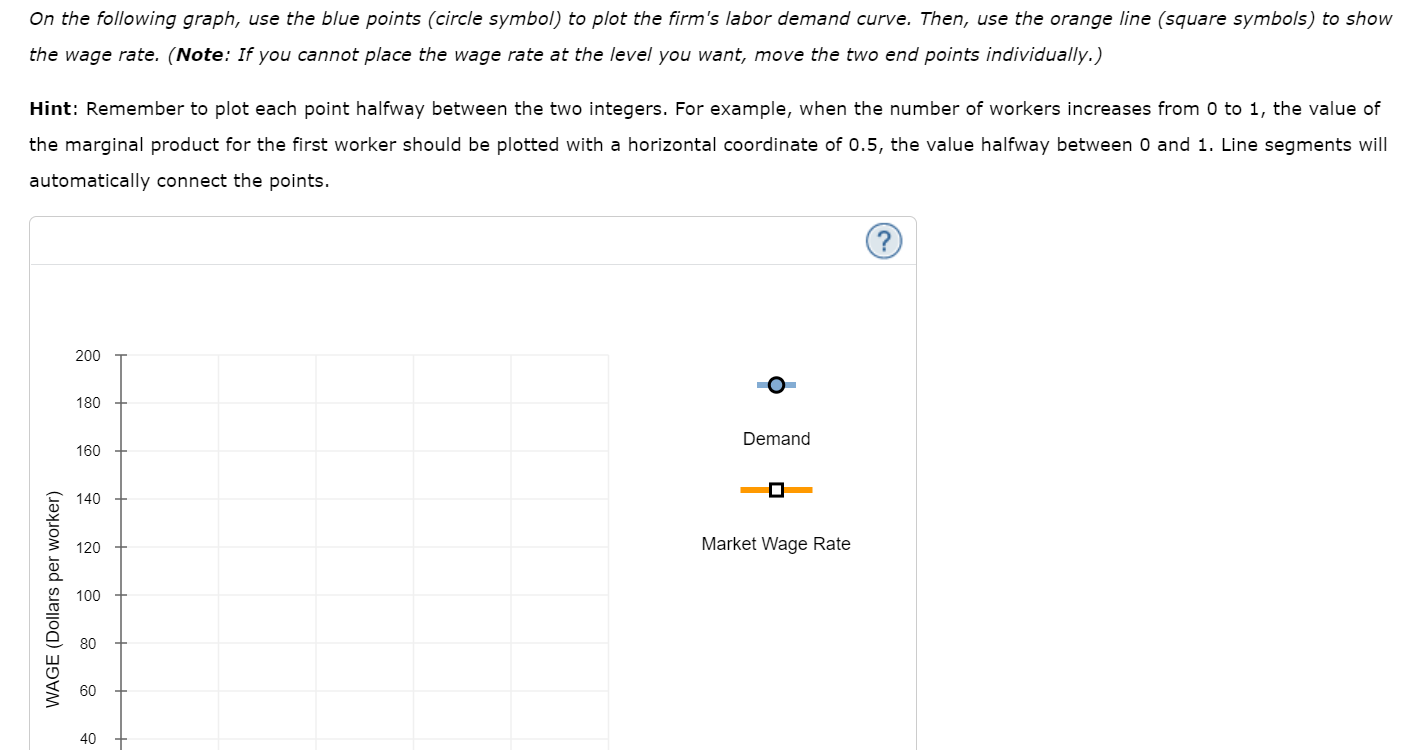
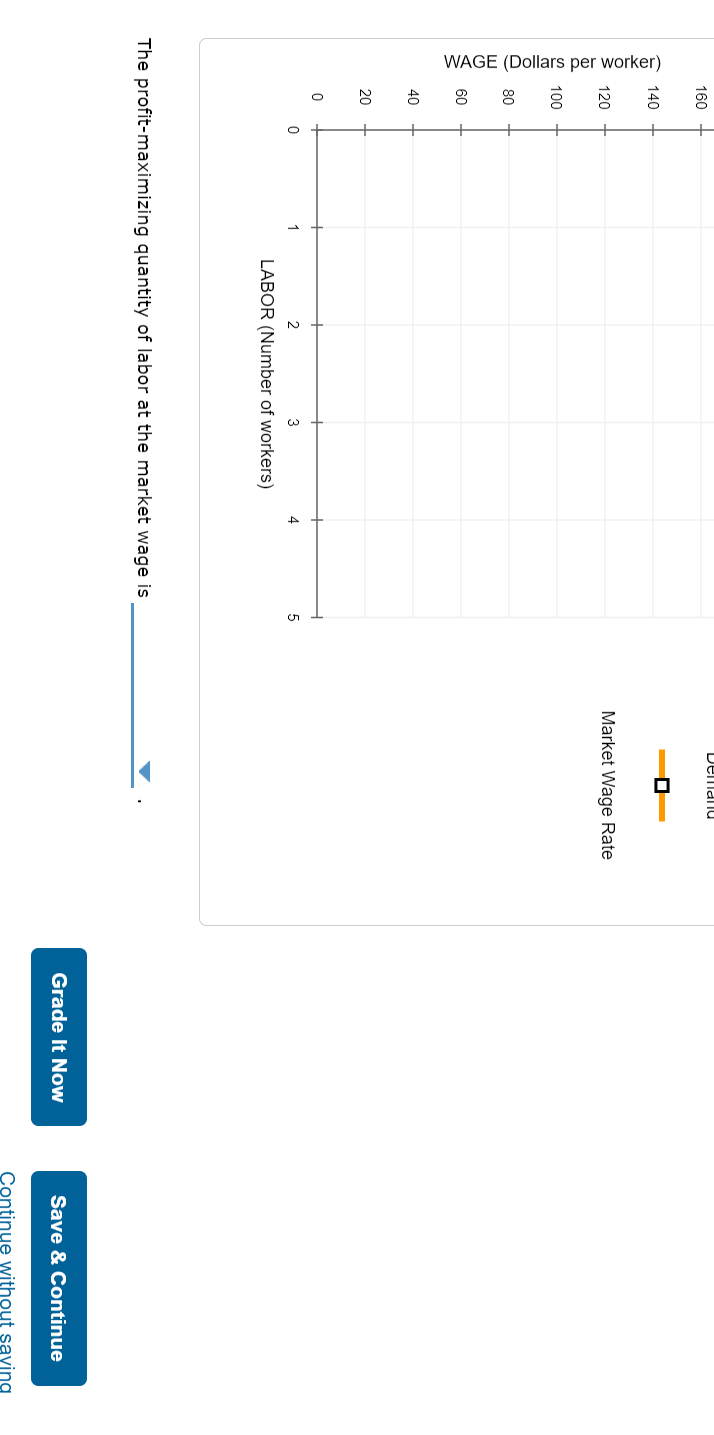
On the following graph, use the blue points (circle symbol) to plot the firm's labor demand curve. Then, use the orange line (square symbols) to show the wage rate. (Note: If you cannot place the wage rate at the level you want, move the two end points individually.) Hint: Remember to plot each point halfway between the two integers. For example, when the number of workers increases from 0 to the value of the marginal product for the first worker should be plotted with a horizontal coordinate of \( 0.5 \), the value halfway between 0 and 1 . Line segments will automatically connect the points.
The profit-maximizing quantity of labor at the market wage is
Expert Answer
Solution;- Value of marginal product of labor= marginal product of la