Home /
Expert Answers /
Economics /
2-equilibrium-in-the-money-market-the-following-diagram-represents-the-money-market-in-the-united-pa522
(Solved): 2. Equilibrium in the money market The following diagram represents the money market in the United ...
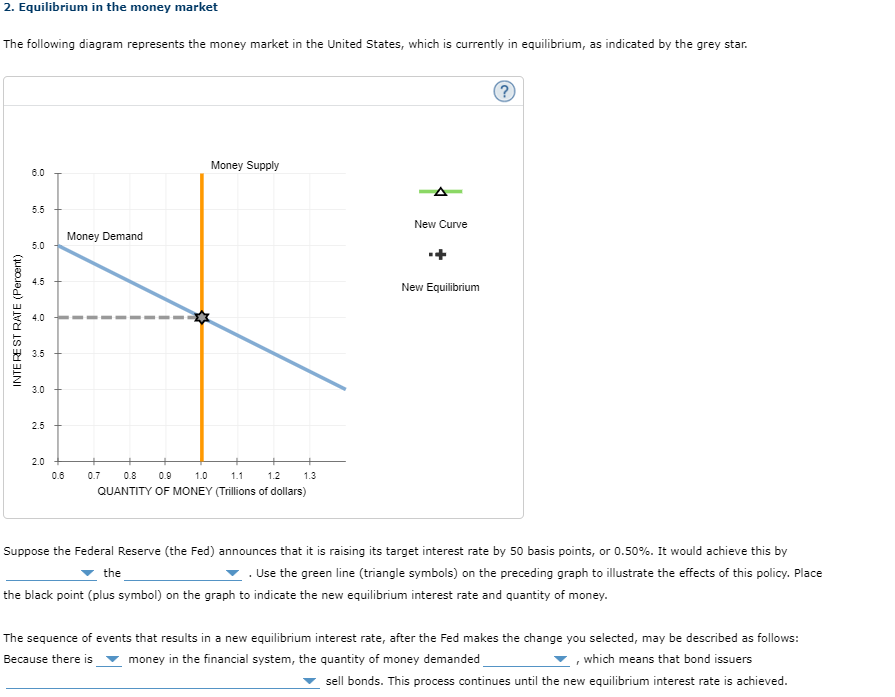
2. Equilibrium in the money market The following diagram represents the money market in the United States, which is currently in equilibrium, as indicated by the grey star. ? Money Supply 6.0 5.5 New Curve 5.0 4.5 New Equilibrium 4.0 3.5 3.0 2.5 2.0 0.6 0.7 0.8 0.9 1.0 1.1 1.2 1.3 QUANTITY OF MONEY (Trillions of dollars) Suppose the Federal Reserve (the Fed) announces that it is raising its target interest rate by 50 basis points, or 0.50%. It would achieve this by the . Use the green line (triangle symbols) on the preceding graph to illustrate the effects of this policy. Place the black point (plus symbol) on the graph to indicate the new equilibrium interest rate and quantity of money. The sequence of events that results in a new equilibrium interest rate, after the Fed makes the change you selected, may be described as follows: Because there is money in the financial system, the quantity of money demanded which means that bond issuers I sell bonds. This process continues until the new equilibrium interest rate is achieved. INTEREST RATE (Percent) Money Demand