Home /
Expert Answers /
Advanced Physics /
2-efficiency-of-an-engine-design-the-graph-shows-a-gas-cycle-that-uses-0-04-moles-of-ideal-pa681
(Solved): 2. Efficiency of an engine design The graph shows a gas cycle that uses \( 0.04 \) moles of ideal ...
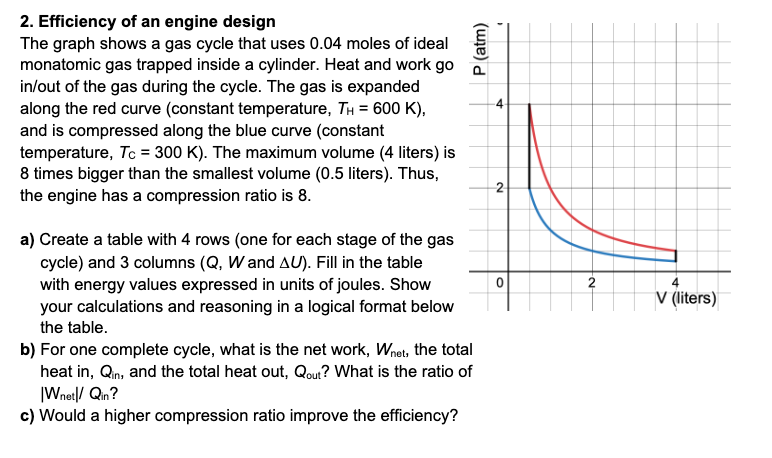
2. Efficiency of an engine design The graph shows a gas cycle that uses \( 0.04 \) moles of ideal monatomic gas trapped inside a cylinder. Heat and work go in/out of the gas during the cycle. The gas is expanded along the red curve (constant temperature, \( T_{\mathrm{H}}=600 \mathrm{~K} \) ), and is compressed along the blue curve (constant temperature, \( T_{C}=300 \mathrm{~K} \) ). The maximum volume (4 liters) is 8 times bigger than the smallest volume ( \( 0.5 \) liters). Thus, the engine has a compression ratio is 8 . a) Create a table with 4 rows (one for each stage of the gas cycle) and 3 columns \( (Q, W \) and \( \Delta U) \). Fill in the table with energy values expressed in units of joules. Show your calculations and reasoning in a logical format below the table. b) For one complete cycle, what is the net work, \( W_{\text {net, }} \), the tota heat in, \( Q_{\text {in }} \), and the total heat out, \( Q_{\text {out }} \) ? What is the ratio of |W \( W_{\text {net }} / Q_{\text {in }} \) ? c) Would a higher compression ratio improve the efficiency?
Expert Answer
Our approach will be to use the first low of thermodynamics to calculate Q, W and ?U by using the first law of thermodynamics Mathematically, ?U+W=Q T
