Home /
Expert Answers /
Economics /
11-working-with-numbers-and-graphs-q1-the-following-graph-shows-the-marginal-cost-mc-marginal-r-pa766
(Solved): 11. Working with Numbers and Graphs Q1 The following graph shows the marginal cost (MC), marginal r ...

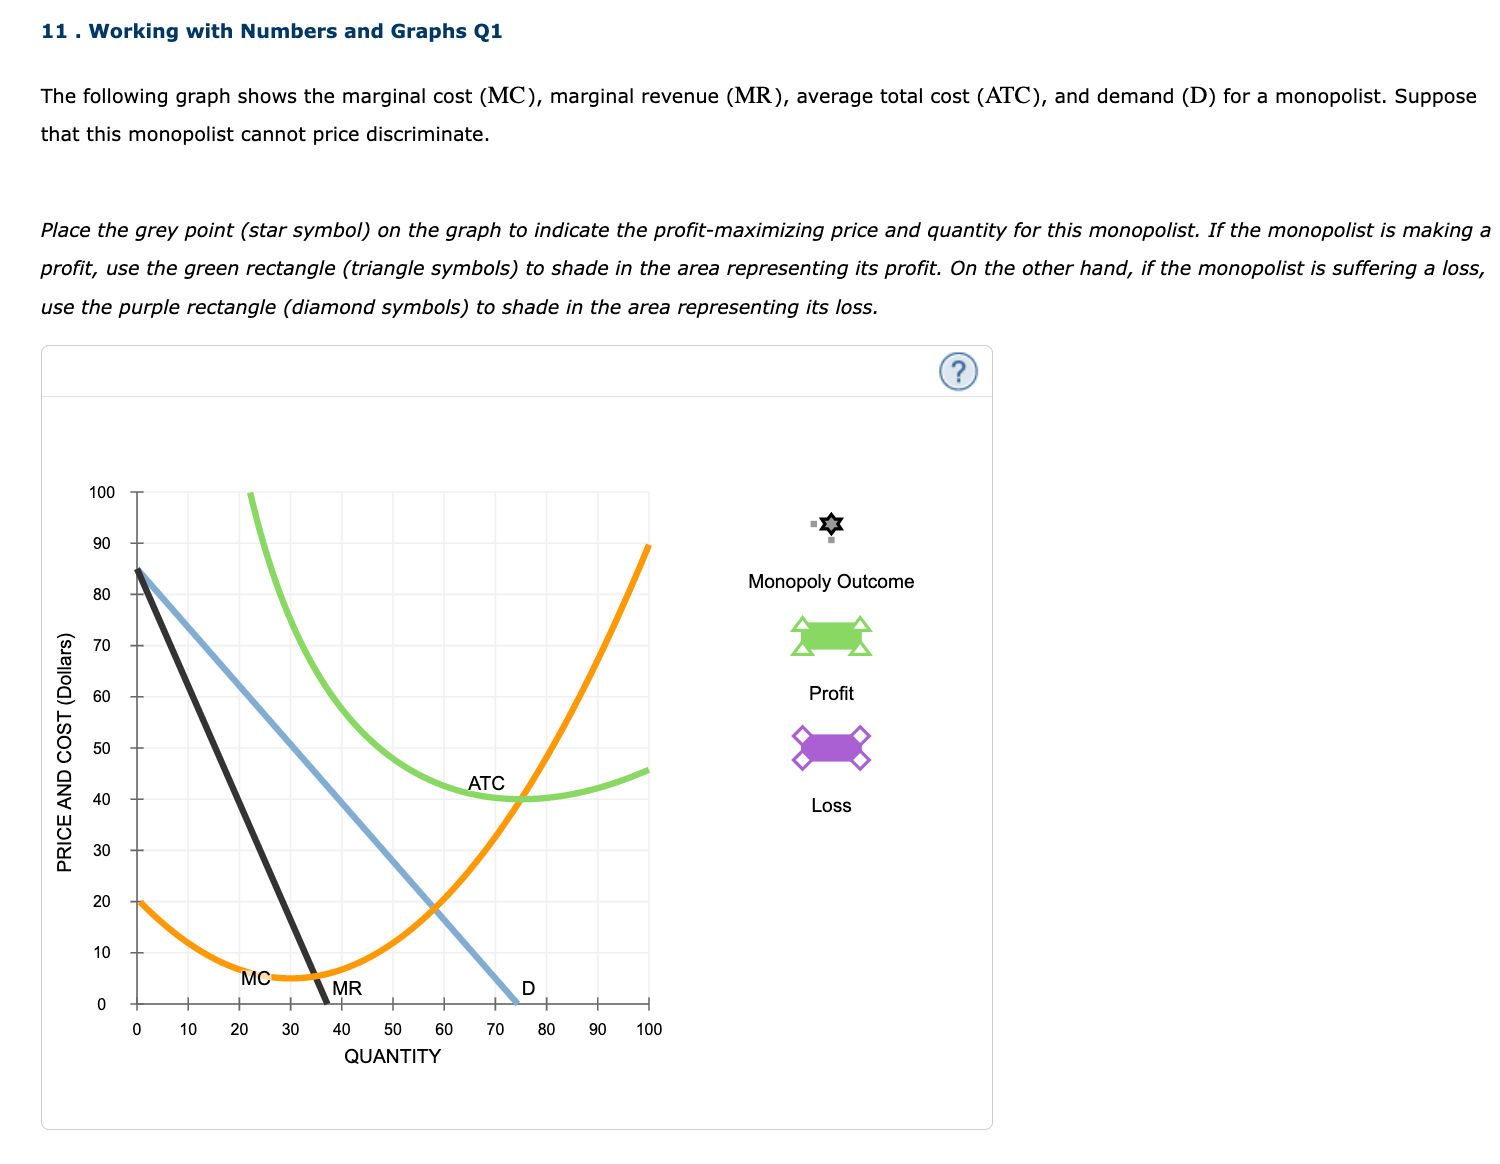
11. Working with Numbers and Graphs Q1 The following graph shows the marginal cost (MC), marginal revenue (MR), average total cost (ATC), and demand (D) for a monopolist. Suppose that this monopolist cannot price discriminate. Place the grey point (star symbol) on the graph to indicate the profit-maximizing price and quantity for this monopolist. If the monopolist is making a profit, use the green rectangle (triangle symbols) to shade in the area representing its profit. On the other hand, if the monopolist is suffering a loss, use the purple rectangle (diamond symbols) to shade in the area representing its loss.