Home /
Expert Answers /
Physics /
11-the-figure-shows-a-diagram-of-the-abdominal-aortic-bifurcation-in-the-human-circulatory-system-pa439
(Solved): 11. The figure shows a diagram of the abdominal aortic bifurcation in the human circulatory system ...
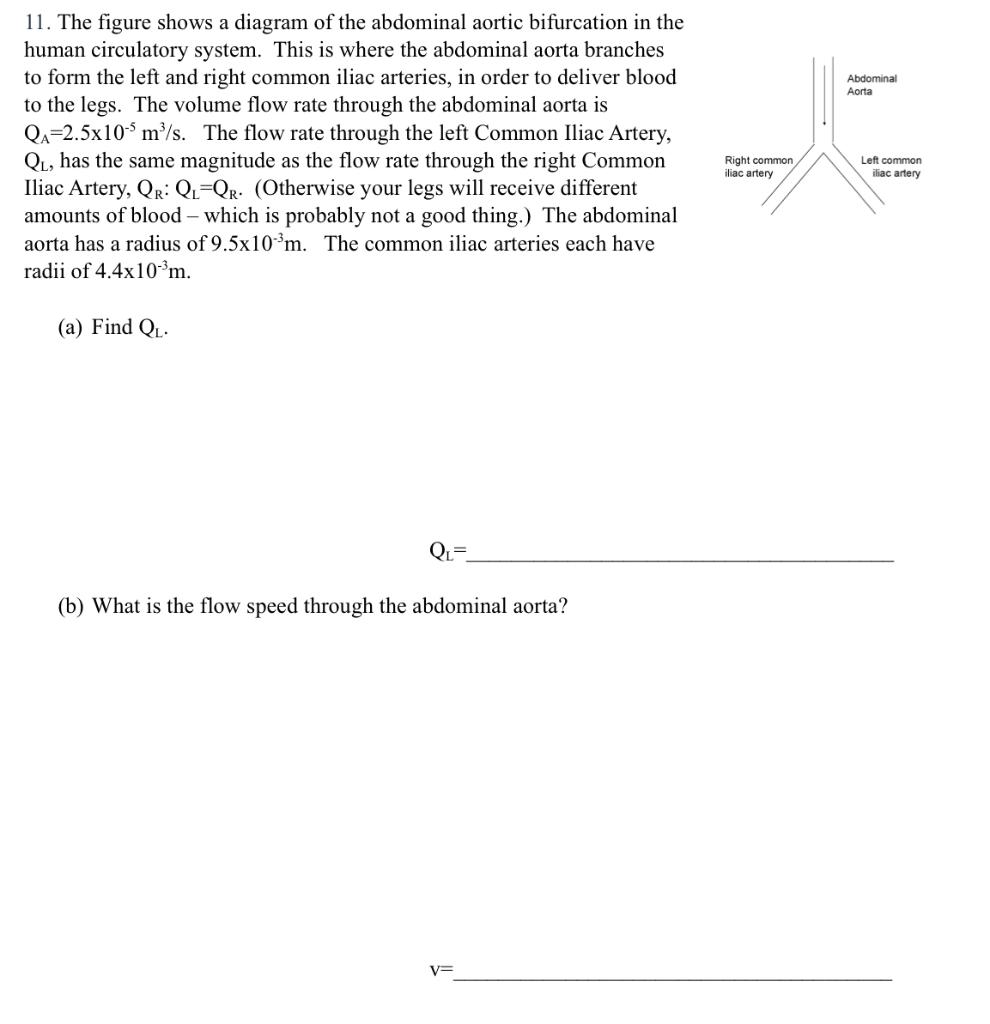
11. The figure shows a diagram of the abdominal aortic bifurcation in the human circulatory system. This is where the abdominal aorta branches to form the left and right common iliac arteries, in order to deliver blood to the legs. The volume flow rate through the abdominal aorta is \( \mathrm{Q}_{\mathrm{A}}=2.5 \times 10^{-5} \mathrm{~m}^{3} / \mathrm{s} \). The flow rate through the left Common Iliac Artery, \( \mathrm{Q}_{\mathrm{L}} \), has the same magnitude as the flow rate through the right Common Iliac Artery, \( \mathrm{Q}_{\mathrm{R}}: \mathrm{Q}_{\mathrm{L}}=\mathrm{Q}_{\mathrm{R}} \). (Otherwise your legs will receive different amounts of blood - which is probably not a good thing.) The abdominal aorta has a radius of \( 9.5 \times 10^{-3} \mathrm{~m} \). The common iliac arteries each have radii of \( 4.4 \times 10^{-3} \mathrm{~m} \). (a) Find \( \mathrm{Q}_{\mathrm{L}} \). (b) What is the flow speed through the abdominal aorta?
Expert Answer
a) The flow rate of the right and left common iliac arte