Home /
Expert Answers /
Economics /
11-a-draw-a-graph-of-yucatan-39-s-ppf-and-explain-how-your-graph-illustrates-a-tradeoff-b-if-yucat-pa470
(Solved): 11. a. Draw a graph of Yucatan's PPF and explain how your graph illustrates a tradeoff. b. If Yucat ...
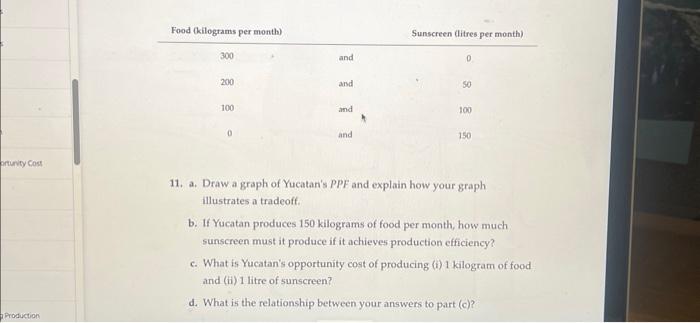
11. a. Draw a graph of Yucatan's PPF and explain how your graph illustrates a tradeoff. b. If Yucatan produces 150 kilograms of food per month, how much sunscreen must it produce if it achieves production efficiency? c. What is Yucatan's opportunity cost of producing (i) 1 kilogram of food and (ii) 1 litre of sunscreen? d. What is the relationship between your answers to part (c)?