Home /
Expert Answers /
Economics /
10-points-the-figure-below-shows-the-domestic-demand-dd-and-domestic-supply-sd-curves-of-pa699
(Solved): 10 points The figure below shows the domestic demand (Dd) and domestic supply (Sd) curves of ...

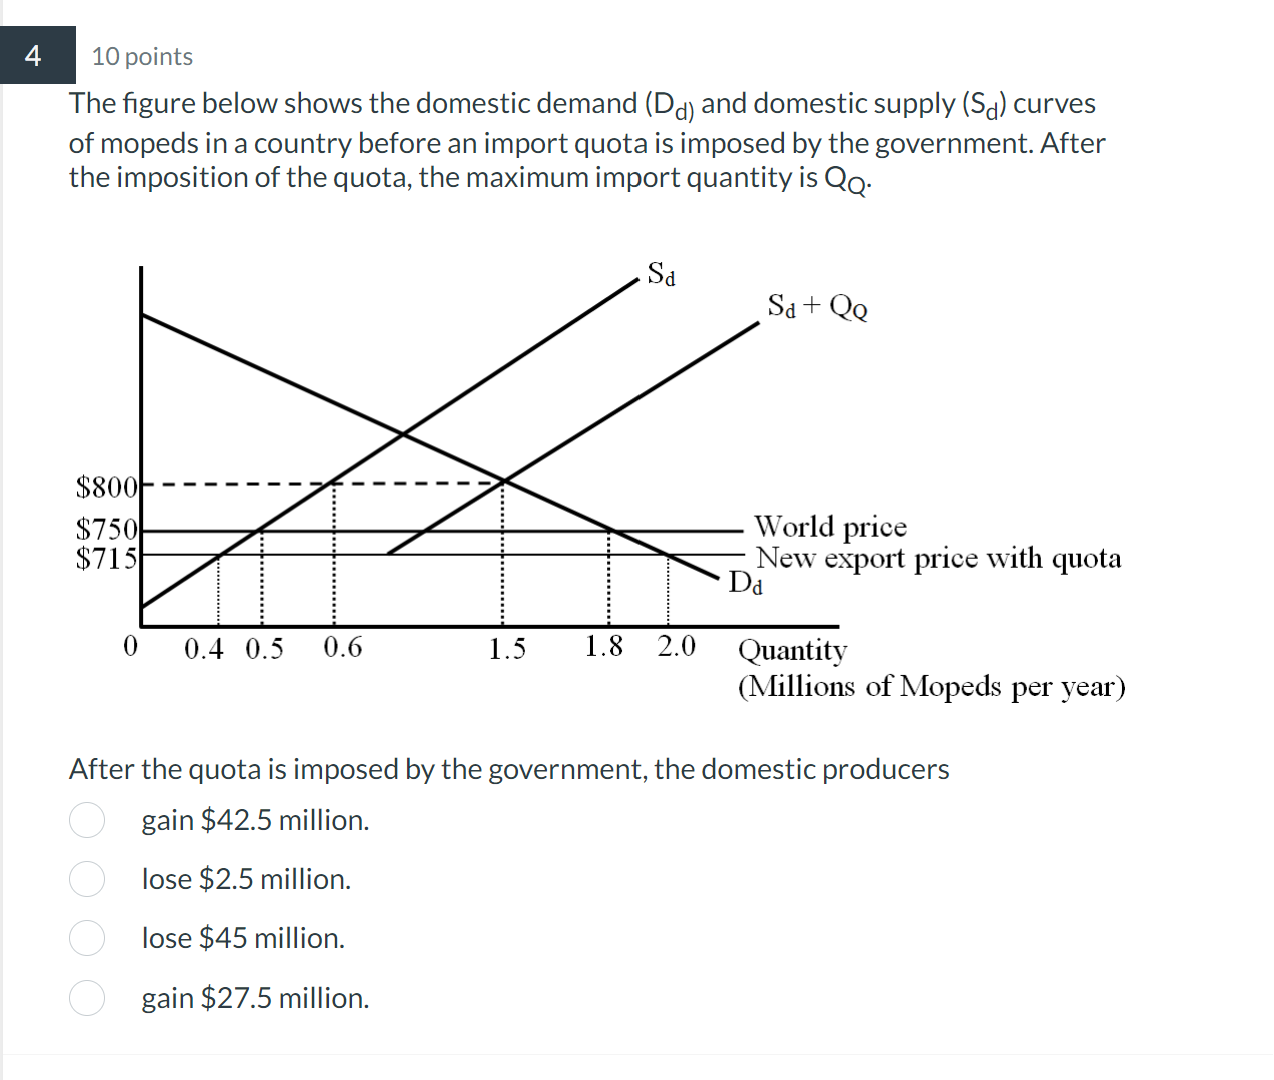
10 points The figure below shows the domestic demand and domestic supply curves of mopeds in a country before an import quota is imposed by the government. After the imposition of the quota, the maximum import quantity is . lota ear) After the quota is imposed by the government, the domestic producers gain million. lose million. lose million. gain million.