Home /
Expert Answers /
Economics /
10-market-equilibrium-and-disequilibrium-the-following-graph-shows-the-monthly-demand-and-supply-c-pa126
(Solved): 10. Market equilibrium and disequilibrium The following graph shows the monthly demand and supply c ...
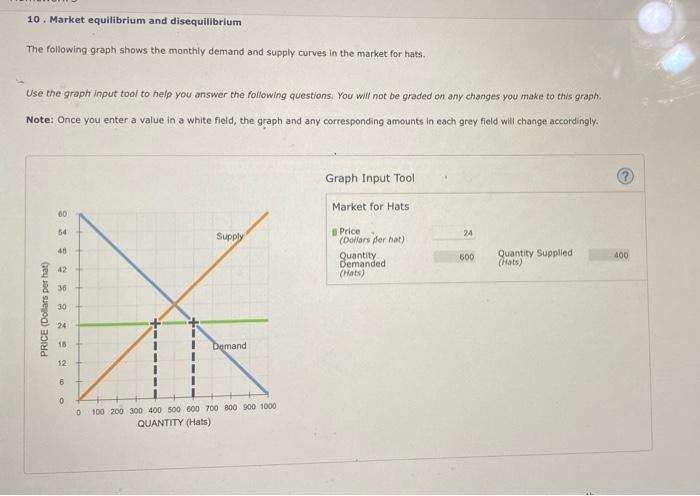
10. Market equilibrium and disequilibrium The following graph shows the monthly demand and supply curves in the market for hats. Use the graph input tool to help you answer the following questions. You will not be graded on any changes you make to this graph. Note: Once you enter a value in a white field, the graph and any corresponding amounts in each grey field will change accordingly.
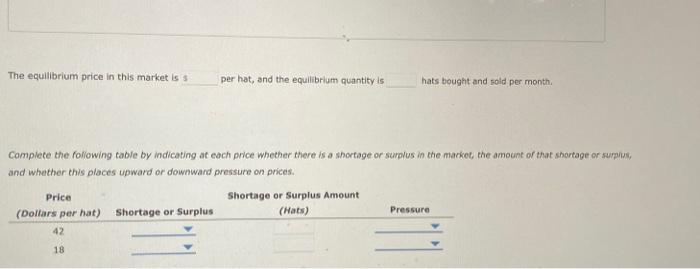
The equilibrium price in this market is per hat, and the equilibrium quantity is hats bought and sold per month. Complete the following table by indicating at each price whether there is a shortage or surplus in the macket, the amount of that shortage or sampis, and whether this places upward or downward pressure on prices.
Expert Answer
Solution.10:-. Dear student, Answer to blank 1: $30 and Answer to blank 2: 500. Let me explain why:- Explanation: Dear student equilibrium pop ups on that point