(Solved): 1. Measures of location - Percentiles, deciles, and quartiles A growth chart is a plot of the perce ...
1. Measures of location - Percentiles, deciles, and quartiles
A growth chart is a plot of the percentiles of growth measurements, such as weight and height, for a population of infants or children. It is used by pediatricians to assess a child's growth over time.
The Centers for Disease Control and Prevention (CDC) is a U.S. agency that has developed growth charts for clinical use by health professionals. The most recent charts were published in 2000.
Growth Chart: Weight by Age for Girls 0-24 Months at the 2nd, 5th, 10th, 25th, 50th, 75th, 90th, 95th, and 98th Percentiles
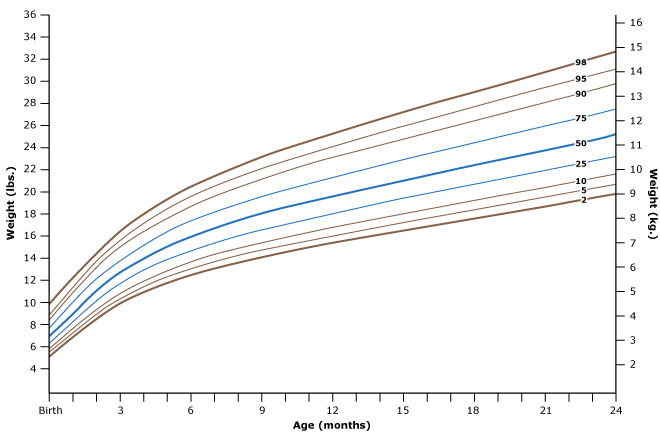
The 2000 CDC growth charts use a reference population of both breast-fed and formula-fed infants. Breast-fed babies tend to gain weight more rapidly than formula-fed babies in the first 2 to 3 months of their lives, but they tend to weigh less than formula-fed babies from 6 to 12 months.
Sarah is a healthy baby who was exclusively breast-fed for her first 12 months. Which of the following is most likely a description of her weights (at 3, 6, 9, and 12 months of age) as percentiles of the CDC growth chart reference population?
a. 40th percentile at 3 months; 40th percentile at 6 months; 40th percentile at 9 months; 40th percentile at 12 months
b. 70th percentile at 3 months; 40th percentile at 6 months; 30th percentile at 9 months; 25th percentile at 12 months
c. 80th percentile at 3 months; 80th percentile at 6 months; 80th percentile at 9 months; 90th percentile at 12 months
d. 20th percentile at 3 months; 50th percentile at 6 months; 80th percentile at 9 months; 90th percentile at 12 months
Thank you in advance. I really appreciate it.
Expert Answer
Given information,A growth c