Home /
Expert Answers /
Operations Management /
1-from-the-following-x-bar-and-r-chart-where-n-3-to-conduct-process-capability-analysis-the-spe-pa263
(Solved): 1. From the following X-bar and R chart, where n=3, to conduct process capability analysis. The spe ...
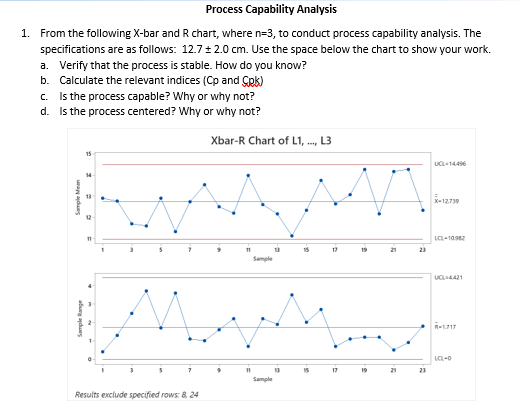
1. From the following -bar and chart, where , to conduct process capability analysis. The specifications are as follows: . Use the space below the chart to show your work. a. Verify that the process is stable. How do you know? b. Calculate the relevant indices ( and ) c. Is the process capable? Why or why not? d. Is the process centered? Why or why not?