Home /
Expert Answers /
Biology /
1-describe-the-data-shown-in-figure-2-10-points-2-why-did-the-authors-show-western-blot-bands-pa176
(Solved): 1. Describe the data shown in Figure 2 (10 points). 2. Why did the authors show Western blot bands ...
![Figure 2. Effects of LE-MCO on morphology of epididymal fat pads (A) and hepatic lipid accumulation (B). CS7BL./6] mice were](https://media.cheggcdn.com/study/d43/d4328fd4-52e0-4d3b-b976-abb7d9582060/image)
1. Describe the data shown in Figure 2 (10 points). 2. Why did the authors show Western blot bands for \( \beta \)-actin beneath each of the other proteins (SREBP2, SREBP 1c, FAS, phospho-ACC, and CD36) in Figure 3, panels A and B (3 points)? Type your answer here
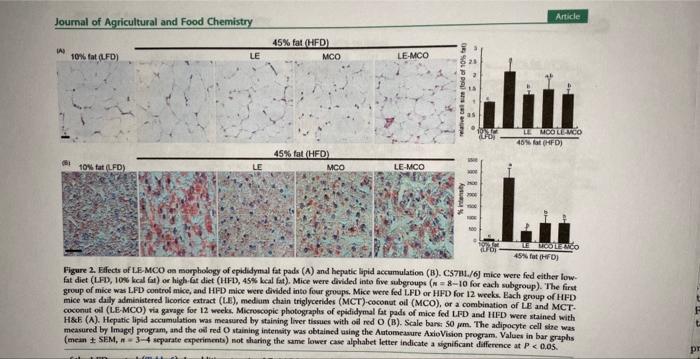
Journal of Agricultural and Food Chemistry Article Figure 2. Effects of LEMCO aa mapphology of epididymul fat pads (A) and heputic lipid accumulation (B). C57al./6) mice were fed either low. Gat diet (LFD, \( 10 \% \) keal fat) or high-Gt diet (HF-D, 45\% keal fat). Mice were divided into five subgroups \( (m=8-10 \) for each subgroup). The first group of mice was LFD control mice, and HFD mice were divided into four groups. Mice were fed LFD or HFD for 12 weeks. Each group of HFD mice was daly administered licorice extract (LE), mediam chain triglycerides (MCT)-coconut oil (MCO), of a combination of LE and MCT. coconut oil (LE-MCO) via gavage for 12 weeks, Microscopic photograpls of epididymul fat padt of mice fed LFD and HFD were stained with H\&kE \( (\mathrm{A}) \). Hepatic lipid accumulation was measured by staining liver tissues with oll ned \( \mathrm{O} \) (B). Scale burs \( 50 \mathrm{jam} \). The aclipocyte cell size was measured by lmagel program, and the oul red \( \mathrm{O} \) staining intensity was obtained using the Automeasure AxioVision program. Values in bar graphs (mean \( \pm \mathrm{SE} M, n=3-4 \) separate experiments) not sharing the same lower case alphabet letter indicate a dignificant difference at \( P<0.05 \).
Figure 2. Effects of LE-MCO on morphology of epididymal fat pads (A) and hepatic lipid accumulation (B). CS7BL./6] mice were fed either lowfat diet (LFD, \( 10 \% \) keal fat) or high. fat diet (HFD, \( 45 \% \) keal fat). Mice were divided into five subgroups ( \( n=8-10 \) for each subgroup). The first group of mice was LFD control mice, and HFD mice were divided into four groups. Mice were fed LFD or HFD for 12 weeks. Each group of HFD mice was daily administered licorice extract (LE), medium chain triglycerides (MCT)-coconut oil (MCO), or a combination of LE and MCT. coconut oil (LE-MCO) via gavage for 12 weeks. Microscopic photographs of epididymal fat pads of mice fed LFD and HFD were stained with H\&E (A). Hepatic lipid accumulation was measured by staining liver tissues with oil red \( O \) (B). Scale bars: 50 pm. The adipocyte cell sire was measured by lmageJ program, and the oil red \( \mathrm{O} \) staining intensity was obtained using the Automeasure AxioVision program. Values in bar graphs (mean \( \pm \) SEM, \( n=3-4 \) separate experiments) not sharing the same lower case alphabet letter indicate a significant difference at \( P<0.05 \).
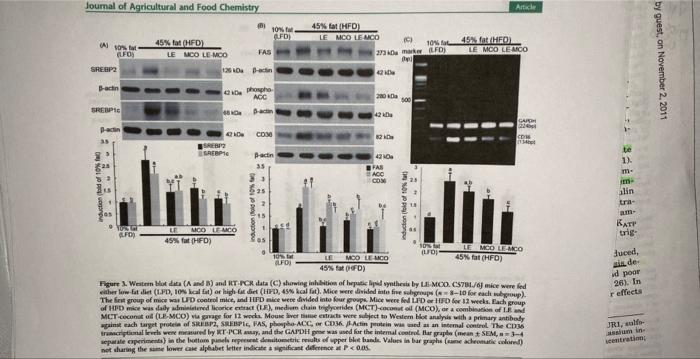
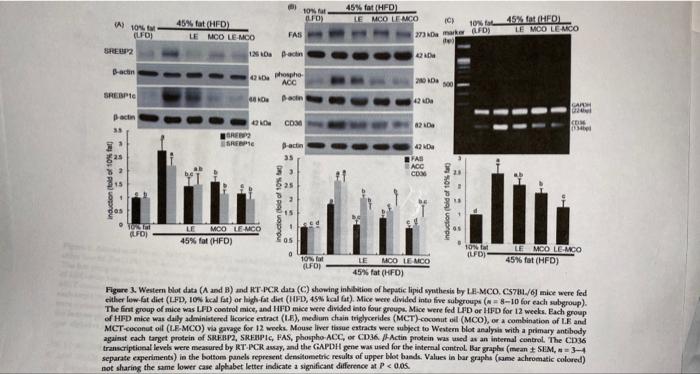
The fint group of mice was LFD cootrol mice, and HFD mice were divited into four grouph Mise were fed LTD or HFD for 12 weeks, Each group of HFD mice was daily adminiatered licorice entract (I.E), medium chain trighcerides (MCT)-coconut oll (MCO), or a combination of L.E and MCT-coconot oif (LE-MCO) via gavage for 12 wekk. Mouse liver tiasue extracts were mbject to Westem blot analyia with a primary antibouly tranecriptional levels were measured by RT-PCR awey, and the CAPDH gene was used for the internal control. Bar graphar (mean \( \pm \) SEM, n \( =3 \) separate experiments) in the bottom panels represient demitumetric results of upper blot baske. Values in bar graphs (iame acheomatic colored) not sharing the same lower case alphabet letter indicate a significant difference at \( P<0.05 \).
Expert Answer
Figure 2 depicts the effect of LE-MECO on the High fat diets on epididymal fat pads and hepatic lipid accu