Home /
Expert Answers /
Economics /
1-below-is-a-supply-demand-diagram-of-the-market-for-rental-housing-e-using-the-letters-to-indic-pa999
(Solved): 1. Below is a supply-demand diagram of the market for rental housing: e) Using the letters to indic ...
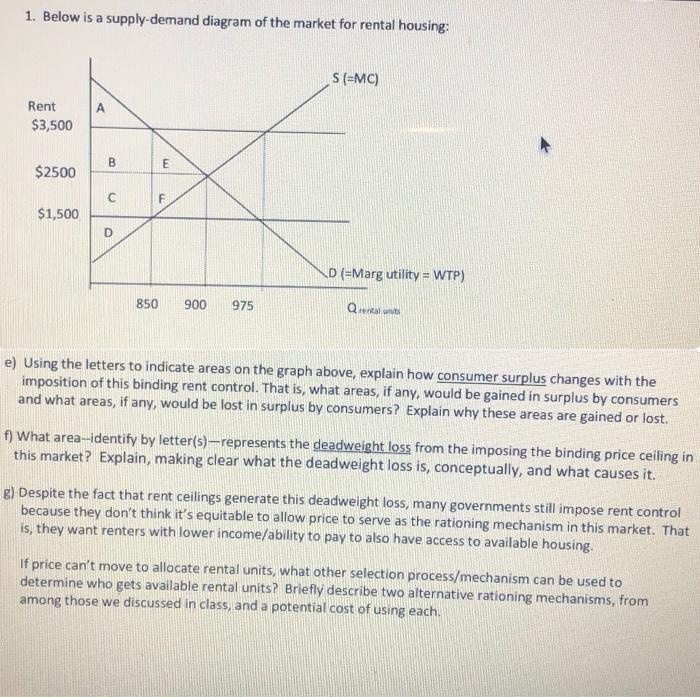
1. Below is a supply-demand diagram of the market for rental housing: e) Using the letters to indicate areas on the graph above, explain how consumer surplus changes with the imposition of this binding rent control. That is, what areas, if any, would be gained in surplus by consumers and what areas, if any, would be lost in surplus by consumers? Explain why these areas are gained or lost. f) What area-identify by letter(s) - represents the deadweight loss from the imposing the binding price ceiling in this market? Explain, making clear what the deadweight loss is, conceptually, and what causes it. g) Despite the fact that rent ceilings generate this deadweight loss, many governments still impose rent control because they don't think it's equitable to allow price to serve as the rationing mechanism in this market. That is, they want renters with lower income/ability to pay to also have access to available housing. If price can't move to allocate rental units, what other selection process/mechanism can be used to determine who gets available rental units? Briefly describe two alternative rationing mechanisms, from among those we discussed in class, and a potential cost of using each.
Expert Answer
Equilibrium is the situation whe