Home /
Expert Answers /
Statistics and Probability /
1-assume-that-a-randomly-selected-subject-is-given-a-bone-density-test-those-test-scores-are-no-pa333
(Solved): 1. Assume that a randomly selected subject is given a bone density test. Those test scores are no ...
1.
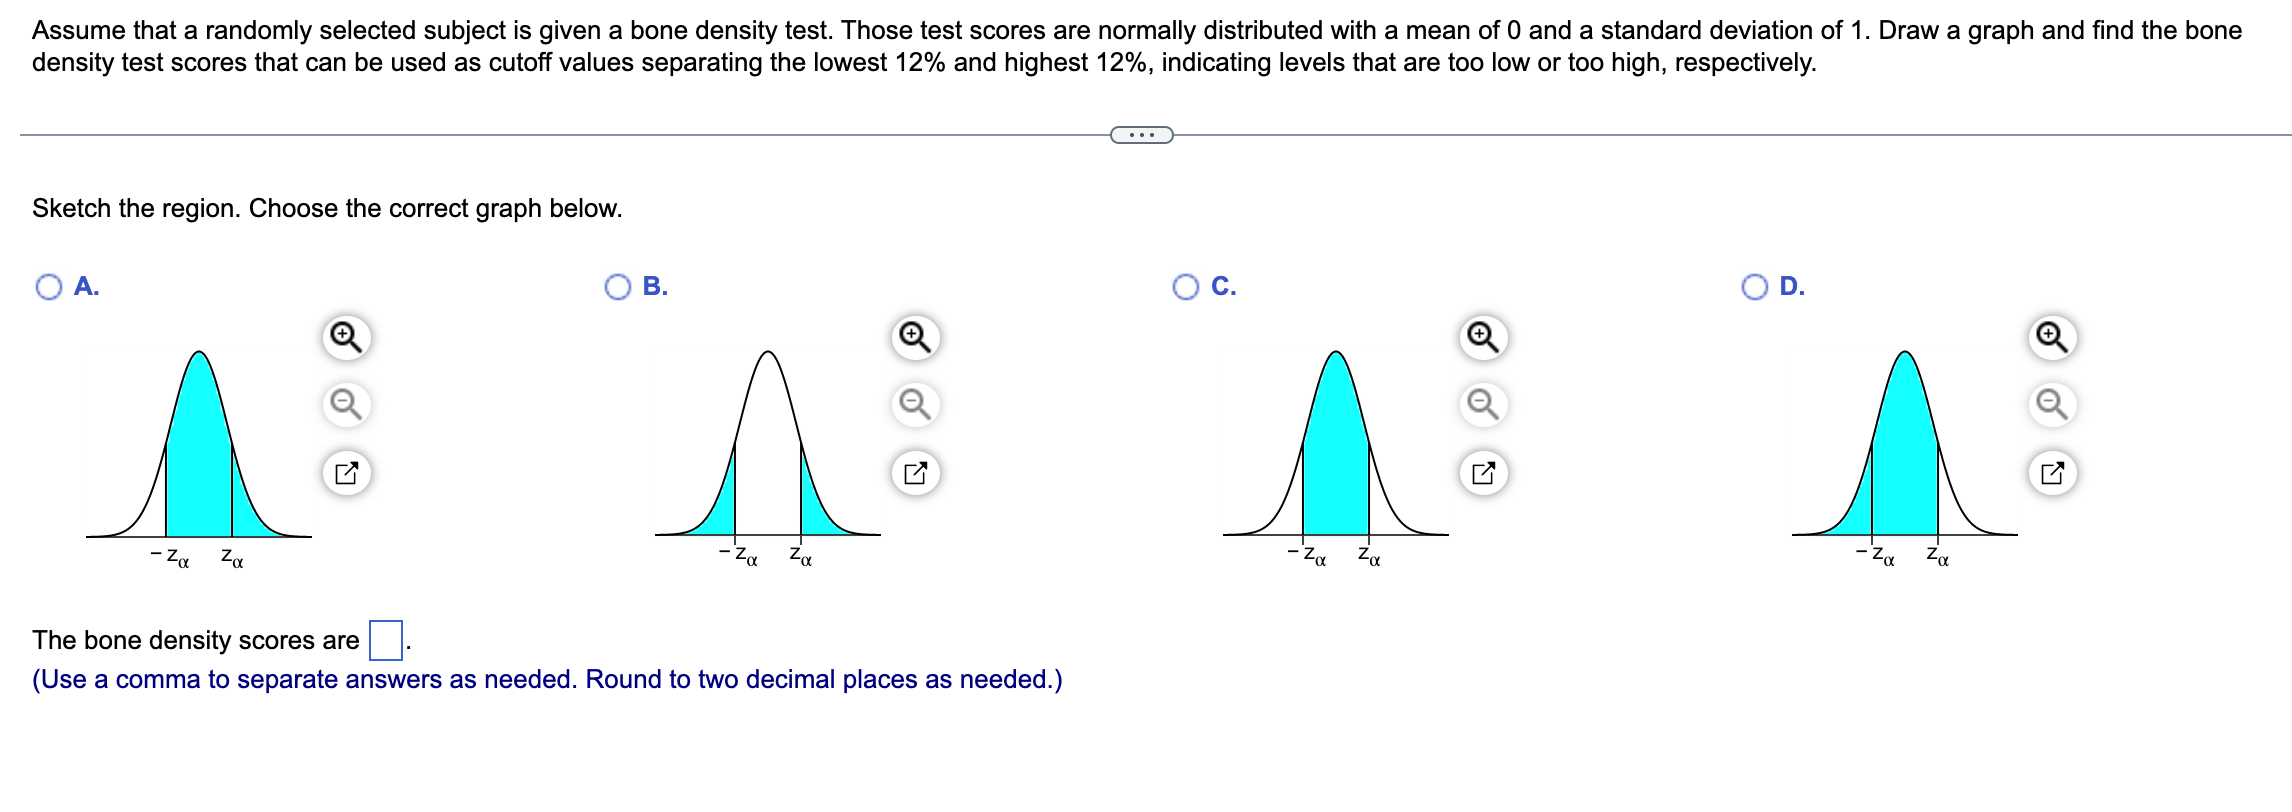
Assume that a randomly selected subject is given a bone density test. Those test scores are normally distributed with a mean of 0 and a standard deviation of 1 . Draw a graph and find the bone density test scores that can be used as cutoff values separating the lowest and highest , indicating levels that are too low or too high, respectively. Sketch the region. Choose the correct graph below. A. B. C. D. The bone density scores are (Use a comma to separate answers as needed. Round to two decimal places as needed.)
Expert Answer
Here we are given the following information
